Setup Tomcat within XAMPP
Modify tomcat-users.xml
- [ D:\xampp\tomcat\conf\tomcat-users.xml ]

  <role rolename="manager-gui"/>
  <user username="root" password="tomcat" roles="manager-gui"/>

<!-- This is the user account for Host Manager link -->
  <role rolename="admin-gui"/>
  <user username="admin" password="tomcat" roles="admin-gui"/>
- The username/password for starting the Tomcat JEE server is root/tomcat
Verify the Tomcat status
- Connect to your Apache Server [ http://localhost:8080/ ] and press : Server Status
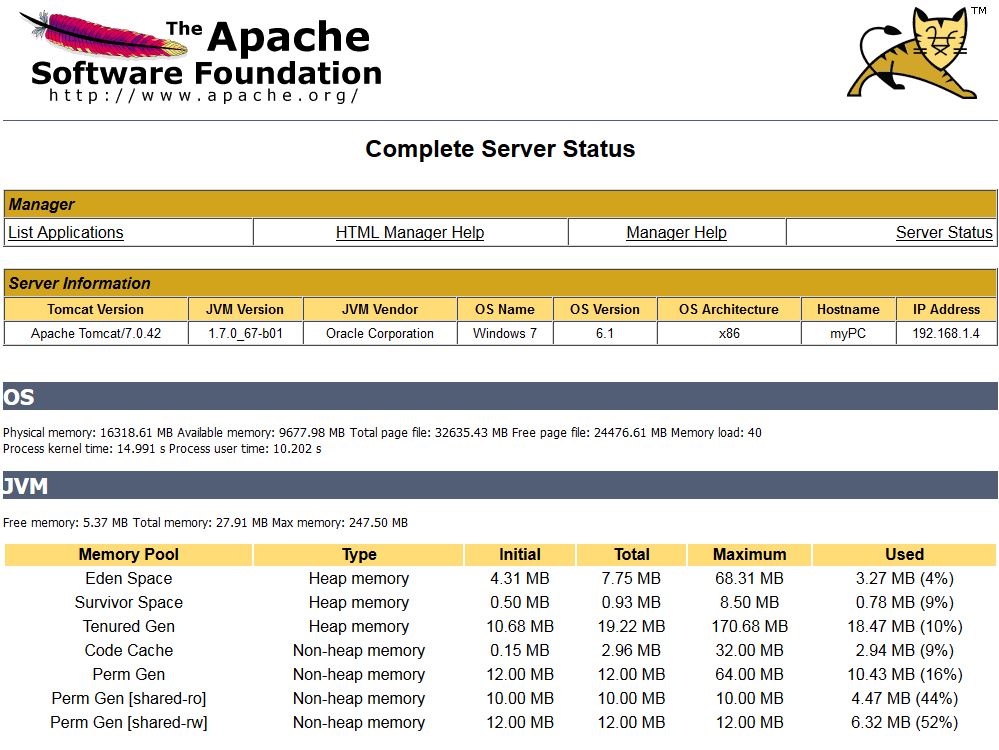
- -> The reported Apache Tomcat version is 7.0.42
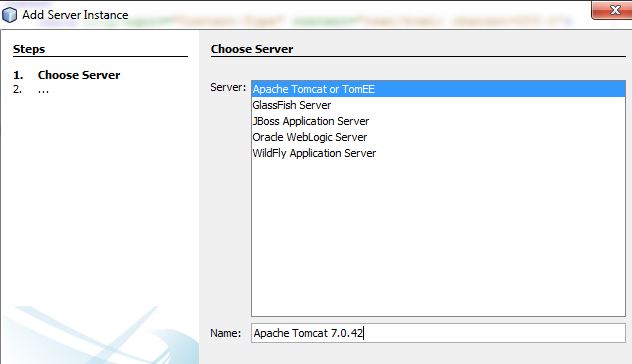
Add XAMPP Tomcat Server to our Netbeans IDE
- Goto Services -> Servers -> Right Click Add Server -> Select Apache Tomcat
- Change the Name attribute to the current Tomcat version and press Next
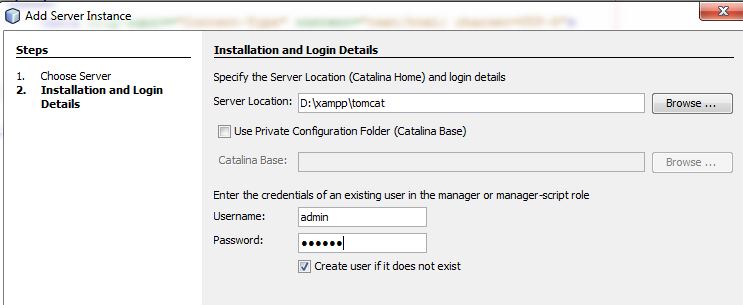
- Fill out the Tomcat Location Details including username password
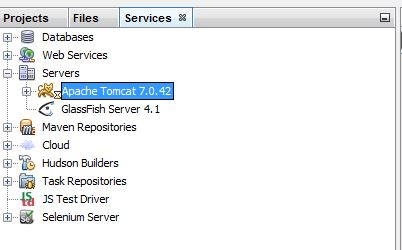
- Now the new Server Entry should be available in the Server panel
- With Right Click on the Apache Tomcat Entry you should be able to start and stop the Tomcat AppServer
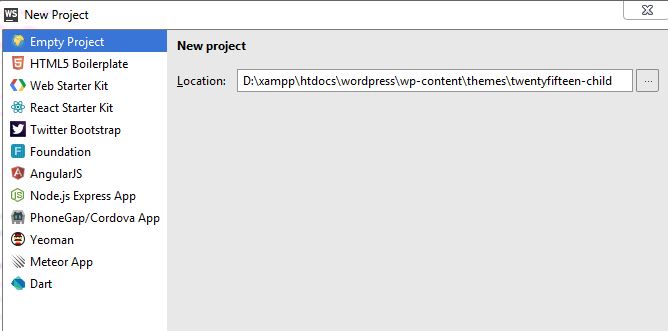
Start a Maven Web Application Project and test the TOMCAT Integration
- NetBeans -> Start Project -> Maven -> Web Application -> Project Name : testFunctionsMVN
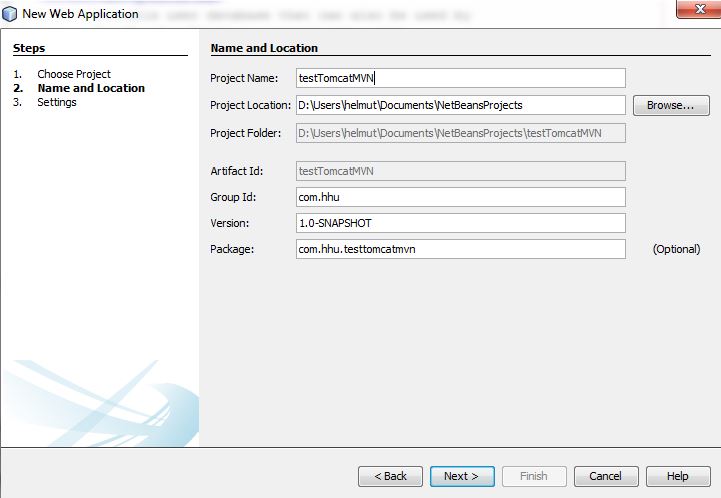
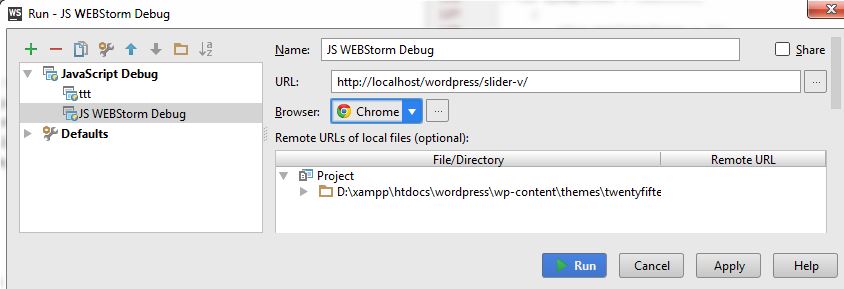
- Select the Tomcat Server and the JEE Version and Press Finish

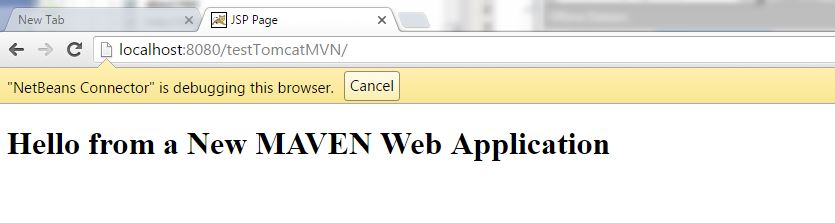
- You may change index.jsp a little bit
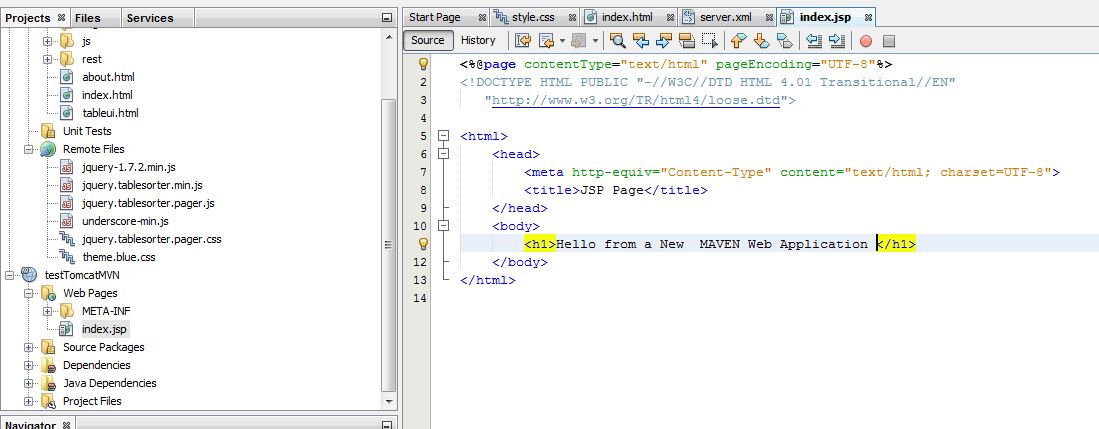
- Finally press F6 to run the application
Reference
Indroduction
During my last development I hit the following problem :
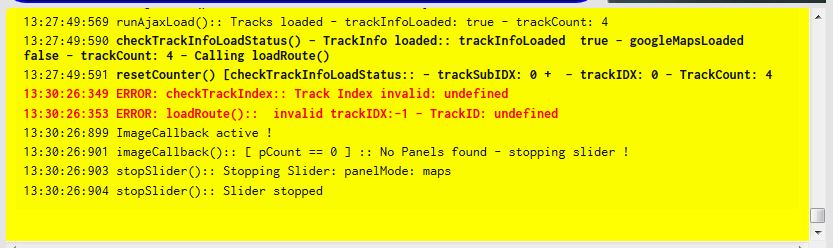
- My Slider application does not start with the following error
- Something goes wrong here but without a Stack Trace debugging is annoying
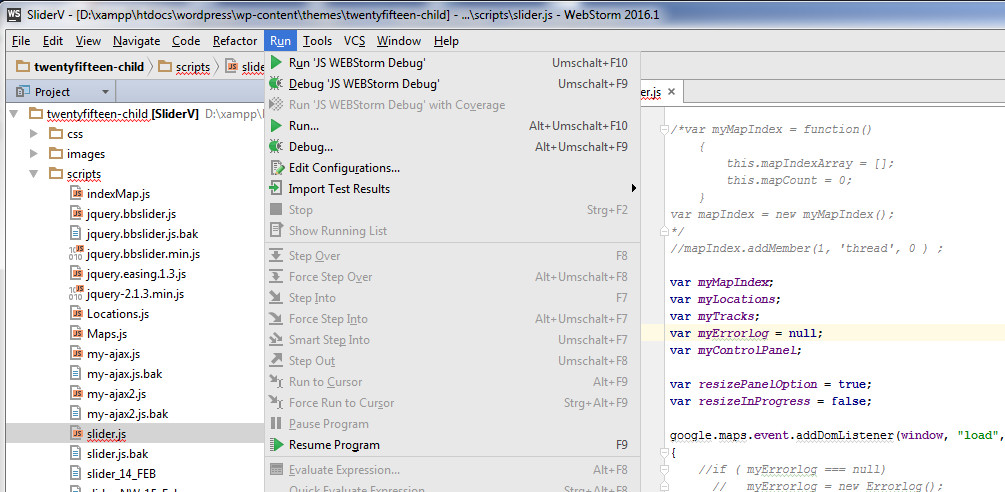
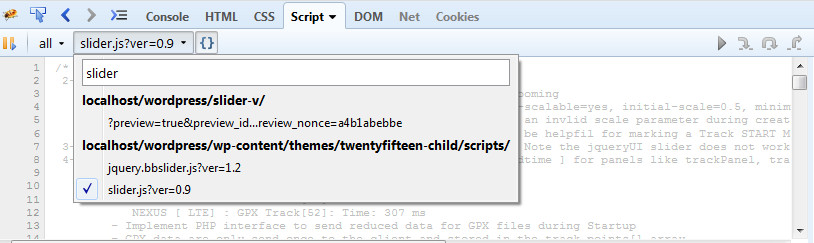
Start Debugging Firebug [ by pressing F12 – Firebug should be already installed ]
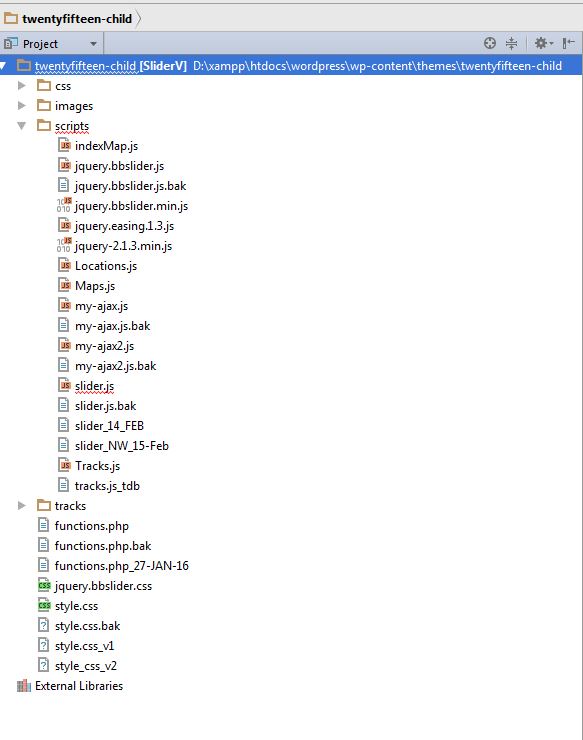
- Preselect our source slider.js within Firebug
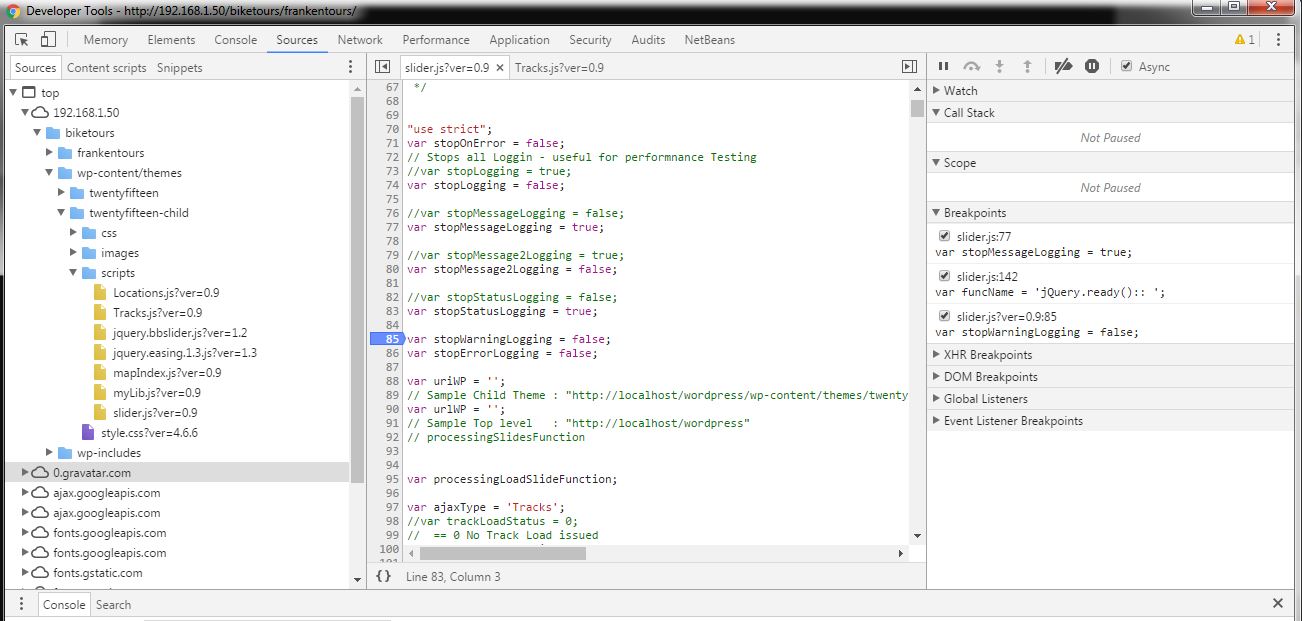
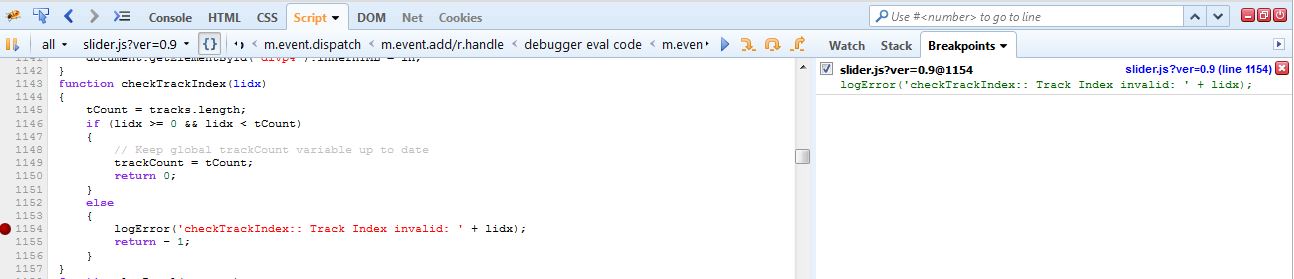
Set a breakpoint in function checkTrackIndex()
- Right click and set the breakpoint at the line where the error condition is handled
- After setting a breakpoint press F8 to continue or you may need to reload your page
Restart the application and check out the status
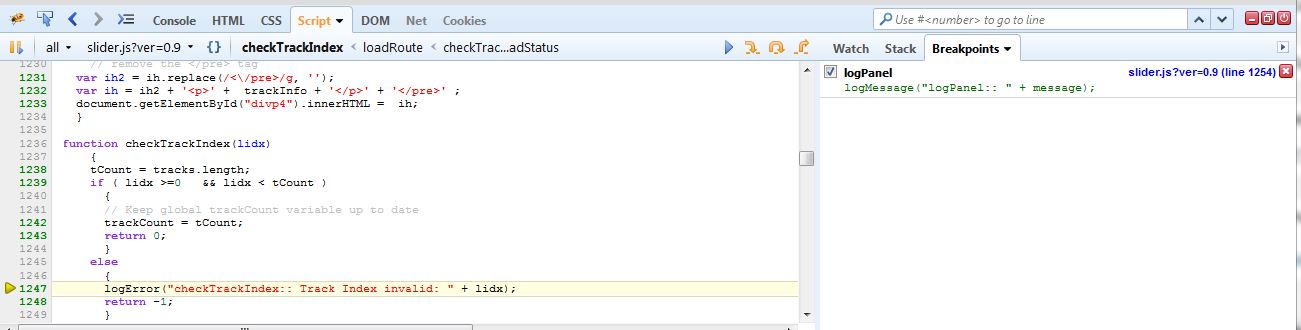
- The application stops at line 1247 in function checkTrackIndex()
- Lets see what detail info is available by pressing the Stack tab
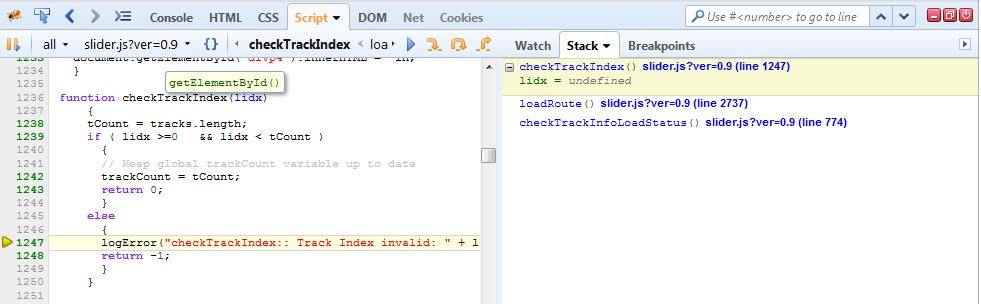
- Now we should have a better understanding what is going on
- checkTrackInfoLoadStatus() calls loadroute() which calls checkTrackIndex()
- In checkTrackIndex() lidx is undefined – Why ?
- press on the loadRoute() function for further investigations

- At line 2737 we can see that checkTrackIndex() is called without a variable
- This explains why the lidx variable in checkTrackIndex() is undefined
Overview
BMT calls          JDBC Driver calls
ut.begin()         oracle.jdbc.xa.client.OracleXAResource
...
ut.commit()        oracle.jdbc.xa.client.OracleXAResource.end
                   oracle.jdbc.xa.client.OracleXAResource.commit  <--- Here we want to set a Breakpoint
Prepare the Breakpoint
Class Name           : oracle.jdbc.xa.client.OracleXAResource
Method Name          : commit
Stop on              : Method Entry
Actions - Suspend    : All Threads
- Select suspend all Threads if you want to avoid that any Wildly Thread is running a rollback
- If you want Transaction Recovery takes place by other Wildfly Threads you may select Suspend Breakpoint Thread
- Don’t use oracle.jdbc.xa.OracleXAResource for debugging as this package only defines abstract methods
Start the Netbeans project in DEBUG MODE
Netbeans Debug -> Debug Main Project
--> Above action will redeploy our project in DEBUG mode

NetBeans: Deploying on WildFly Application Server
    profile mode: false
    debug mode: true
    force redeploy: true
  Undeploying ...
  Initial deploying WFJPA2EL to /usr/local/wildfly-8.2.0.Final/standalone/deployments/WFJPA2EL-1.0.war
  Completed initial distribution of WFJPA2EL
  Deploying /usr/local/wildfly-8.2.0.Final/standalone/deployments/WFJPA2EL-1.0.war
  Application Deployed

Debugger console reports successfully setting the breakpoint in [oracle.jdbc.xa.client.OracleXAResource].commit
  Attaching to localhost:8787
  MethodBreakpoint [oracle.jdbc.xa.client.OracleXAResource].commit successfully submitted.
  User program running

After the program hits a breakpoint runs Debugger Console should report
Method breakpoint hit in oracle.jdbc.xa.client.OracleXAResource.commit at line 553 by thread default task-3.
Thread default task-3 stopped at OracleXAResource.java:553.
How to Copy the Stack Trace after our Worker Thread stops at a Breakpoint
Select Debugging TAB
  default task-7  [ this Thread was stopped by our Debugger ]
     Hidden Soruce Calls
       OracleXAResource.java:553   <-- Right Click here and select  COPY STACK
Stack Sample
"default task-7"
oracle.jdbc.xa.client.OracleXAResource.commit(OracleXAResource.java:553)
org.jboss.jca.adapters.jdbc.xa.XAManagedConnection.commit(XAManagedConnection.java:338)
org.jboss.jca.core.tx.jbossts.XAResourceWrapperImpl.commit(XAResourceWrapperImpl.java:107)
com.arjuna.ats.internal.jta.resources.arjunacore.XAResourceRecord.topLevelOnePhaseCommit(XAResourceRecord.java:679)
com.arjuna.ats.arjuna.coordinator.BasicAction.onePhaseCommit(BasicAction.java:2317)
com.arjuna.ats.arjuna.coordinator.BasicAction.End(BasicAction.java:1475)
com.arjuna.ats.arjuna.coordinator.TwoPhaseCoordinator.end(TwoPhaseCoordinator.java:96)
com.arjuna.ats.arjuna.AtomicAction.commit(AtomicAction.java:162)
com.arjuna.ats.internal.jta.transaction.arjunacore.TransactionImple.commitAndDisassociate(TransactionImple.java:1166)
com.arjuna.ats.internal.jta.transaction.arjunacore.BaseTransaction.commit(BaseTransaction.java:126)
com.arjuna.ats.jbossatx.BaseTransactionManagerDelegate.commit(BaseTransactionManagerDelegate.java:75)
org.jboss.tm.usertx.client.ServerVMClientUserTransaction.commit(ServerVMClientUserTransaction.java:173)
com.hhu.wfjpa2el.JPATestBean.timeoutTest(JPATestBean.java:466)