×
![]()
Node.js Overview
Node.js processing model
- Follows single threaded even loop processing model which can handle more and more concurrent requests easily
- Another important point to keep in mind that Node.js architecture has two types of threads
Main Thread (Single Thread)
- Called as internal thread as well, all the non I/O blocking requests are assigned using Main thread
Worker Thread(s)
- Used for assigning blocking I/O heavy requests
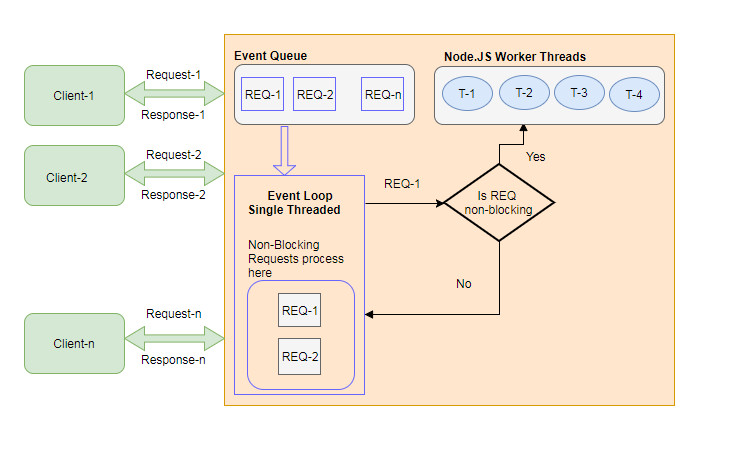
Here are the details on how the single threaded event loop based processing works
- Client sends the request to web sever
- Node.js web server receives client requests from different clients, puts them into a queue. This queue is called event queue
- Node.js has an internal component called event loop which runs the loop on event queue, assigns the request to a single thread if the request is non-blocking
- In case of blocking (I/O heavy) request, event loop will assign this to worker thread
- While worker thread is processing the request, event loop will continue to process other requests available in event queue
Node.js and Standard Webserver Flow-Diagramms
| Node.js Flow Diagram |
 |
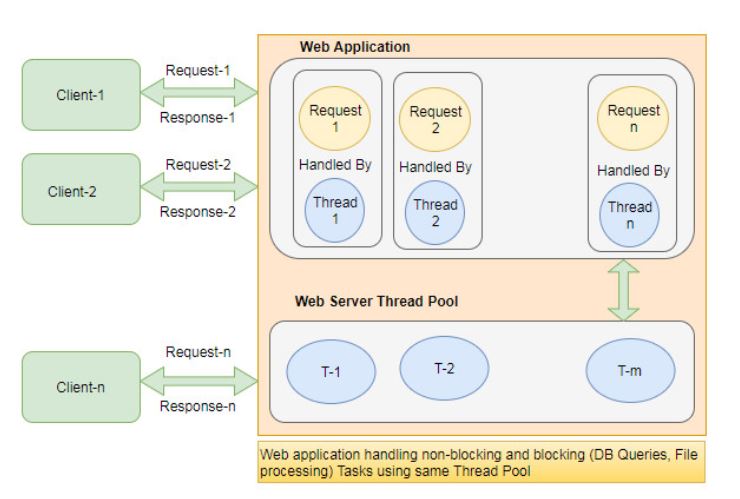
| Standard Webserver Flow Diagram |
 |
My First Node.js Web Application
How it works ?
- Netbeans runs our Code in 2 Steps
- Step1: Netbeans start a nodejs server process to execute HTTP server Code
- –> Our HTTP server is now listening on port : 9900
- Step2: Netbeans starts a Chrome Browser Windows and connects to Port 9900
- –> Our Browser display the Content provided by our Http Server
Run a first Node.js Project
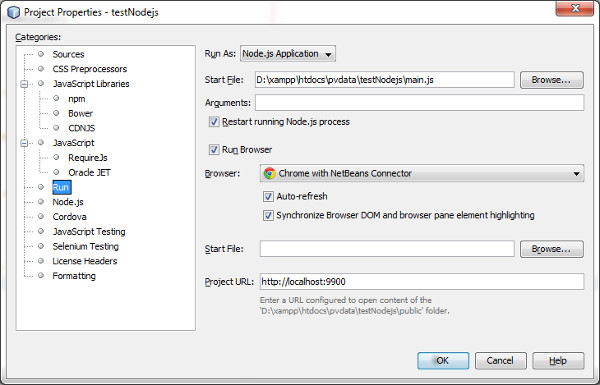
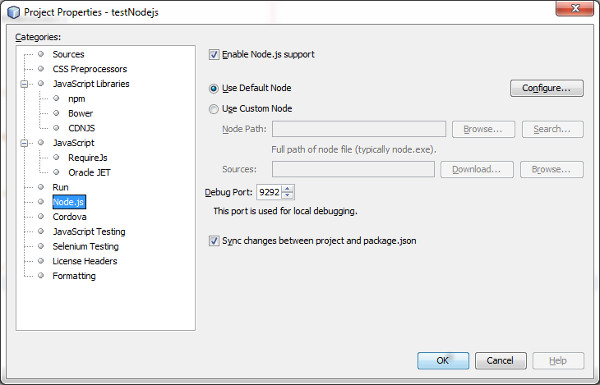
Setup a Node.js project properties within Netbeans
| Step 1 : Configure Netbeans Project Run Methode |
Step 2 : Configure Node.js Properties |
 |
 |
Add the following Code to main.js
const http = require('http');
const port = 9900;

const requestHandler = (request, response) => {
    let funcName = "requestHandler";
    if (request.method === 'GET' && request.url === '/' ){
        dumpMessage(funcName, "Request Method: GET - request URL: " + request.url);
        response.writeHead(200, {"Content-Type": "text/html"});
        response.end('Hello Node.js Server - at:  ' + getTime() + '!');
    }
};

const server = http.createServer(requestHandler);

server.listen(port, (err) => {
    let funcName = "server.listen";
    if (err) {
        return console.log(funcName, 'something bad happened: ' + err);
    }

  dumpMessage(funcName, 'server is listening on port: ' + port);
});

function dumpMessage(testName, mesg) {
    console.log(getTime() + testName + ":: --> " + mesg);
};

function getTime() {
    var ts = new Date();
    return ts.toLocaleTimeString()+ ":" + ts.getMilliseconds() + "  ";
};
Finally run the Node.js Code
| Step 3 : Run the project |
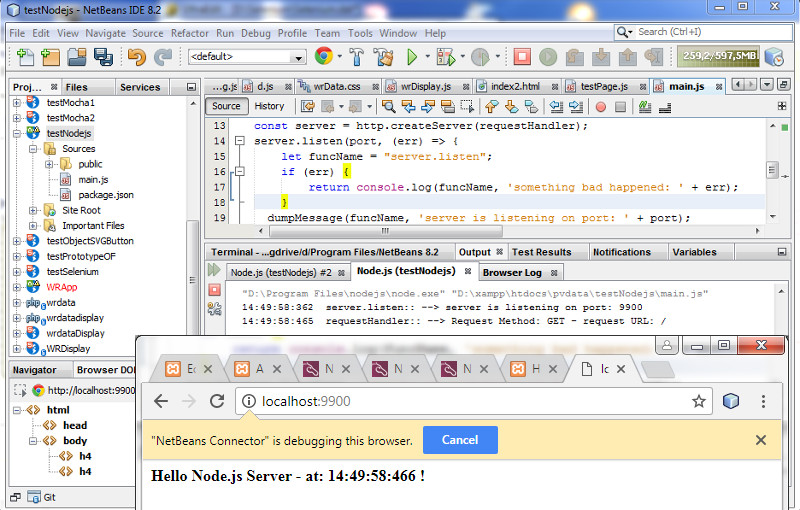 |
Run above Node.js project manaully
Start the http Server
D:\xampp\htdocs\pvdata\testNodejs> "D:\Program Files\nodejs\node.exe"  "D:\xampp\htdocs\pvdata\testNodejs\main.js"
17:14:42:536  server.listen:: --> server is listening on port: 9900
Redirect your browser to the Listening Adress of our Web Server: http://localhost:9900
| Browser Output |
 |
Debugging a Node.js Application with Netbeans – Currently NOT working due to Netbeans Bug 271238
"D:\Program Files\nodejs\node.exe" "--debug-brk=9292" "D:\xampp\htdocs\pvdata\testNodejs\main.js"
 (node:10116) [DEP0062] DeprecationWarning: `node --debug` and `node --debug-brk` are invalid.
Please use `node --inspect` or `node --inspect-brk` instead.

Done.
Debugging ourNode.js Application manually
Start the node.js process with inspect-brk option
- Enable inspector agent
- Listen on default address and port (127.0.0.1:9229)
- Break before user code starts
D:\xampp\htdocs\pvdata\testNodejs> node --inspect-brk main.js
Debugger listening on ws://127.0.0.1:9229/9391ed9f-a46d-4f49-bee2-b83d6dafb055
For help see https://nodejs.org/en/docs/inspector
Attach Chrome Devtools 55+ to the Node.js Debugger process
- Open a Chrome DevTool 55+ Browser session with following URL: chrome://inspect
- Select : Open dedicated DevTools for Node
| Attach Chrome DevTools to Node.js Inspector |
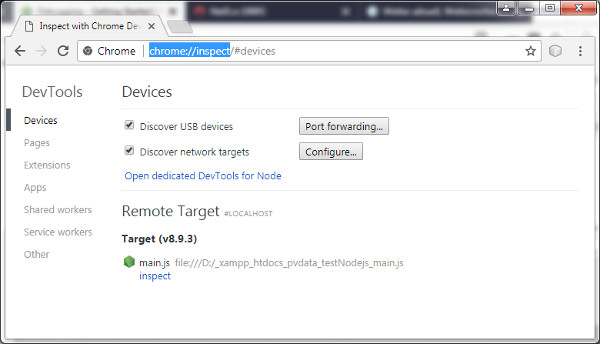 |
CLI should respond with: Debugger attached
D:\xampp\htdocs\pvdata\testNodejs> node --inspect-brk main.js
Debugger listening on ws://127.0.0.1:9229/9391ed9f-a46d-4f49-bee2-b83d6dafb055
For help see https://nodejs.org/en/docs/inspector
Debugger attached.
Start Debugging
| Debug Node.js by viewing Sources and setting Breakpoint |
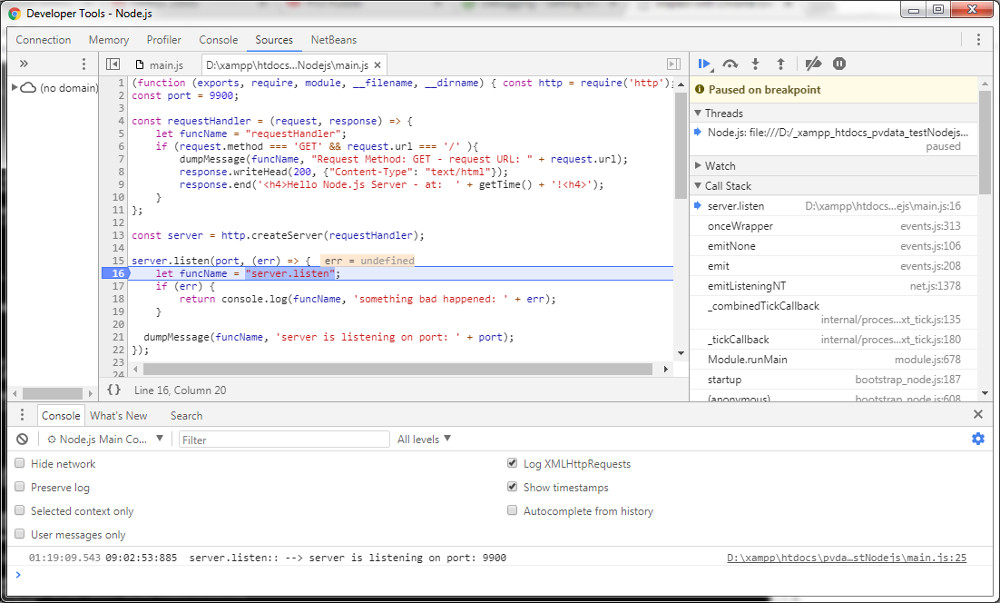 |
Reference


Great site, but the two flow diagram pictures are the same!
Thx Jacco – I have fixed this !
Your blog is very nice… Thanks for sharing your information…
How do you redirect it to the actual website under site root?
I prefer to use Codelobster IDE for Node.js development – http://www.codelobster.com/nodejs.html