Table of Contents
What is JMeter ?
- Jmeter is a s functional testing tool for a web application, file server, web server and even database
- Is easy to configure and provides all needed tools to run HTTP load tests against any WebServer
Download and Install JMeter
Download Jmeter 2.13 from  http://jmeter.apache.org/download_jmeter.cgin
 $ mkdir JMETER
 $ unzip apache-jmeter-2.13.zip
 $ pwd
     /home/oracle/JMETER/apache-jmeter-2.13/bin
 $ chmod 755 jmeter
 $ jmeter
--> GUI should be started !
First JMeter Project
Add Users
Edit > Threads(User) -> Thread Group

Add HTTP Request
Thread Group [ RC ] -> Add -> Sampler -> HTTP request
 Server Name : localhost
 Port Number : 8180
 Path        : /WFJPA2EL-1.0

Add Listener to display HTTP traffic
Thread Group [ RC ] -> Add -> Listener -> View Results Tree

Now Press Start and verify the HTTP traffic
View Result Tree -> Traffic -> Click on a Single HTTP request
There a 3 Viewing Options to display the test results
 - Sampler results
 - Request
 - Response data

Details on above Viewing Option
- Sampler Results
  Thread Name: Thread Group 1-1
  Sample Start: 2015-06-09 08:30:58 CEST
  Load time: 29
  Connect Time: 4
  Latency: 6
  Size in bytes: 4910
  Headers size in bytes: 454
  Body size in bytes: 4456
  Sample Count: 1
  Error Count: 0
  Response code: 200
  Response message: OK

  Response headers:
   HTTP/1.1 200 OK
   Connection: keep-alive
   X-Powered-By: Undertow/1
   Set-Cookie: JSESSIONID=6RuYgEBp_dbe0VnE2S_8FWk2.wls1; path=/WFJPA2EL-1.0
   Server: WildFly/8
   Content-Type: text/html;charset=UTF-8
   Content-Length: 4456
   Date: Tue, 09 Jun 2015 06:30:58 GMT

  HTTPSampleResult fields:
   ContentType: text/html;charset=UTF-8
   DataEncoding: UTF-8

- Request data
  GET http://localhost:8180/WFJPA2EL-1.0/
  [no cookies]
  Request Headers:
  Connection: keep-alive
  Host: localhost:8180
  User-Agent: Apache-HttpClient/4.2.6 (java 1.5)
  Thread Group [ RC ] -> Add -> Sampler -> HTTP request

- Response Data [ The HTML document ! ]
  <?xml version='1.0' encoding='UTF-8' ?>
  <!DOCTYPE html>
  <html xmlns="http://www.w3.org/1999/xhtml"><head id="j_idt2">
        <title>Testing RAC - J2EE JPA2 API! </title>
        <style>
         .BGImage{ background-image: url("resources/images/1920x1200_night.png"); }
        </style></head><body class="BGImage"><table>
   <tbody>
   <tr>
   ...

Add HTTP Cookie Manager and HTTP Cache Manager

Thread Group [ RC ] -> Add -> Config Element -> HTTP Cookie Manager
Thread Group [ RC ] -> Add -> Config Element -> HTTP Cache Manager
HTTP Cache Manager  -> simulates WEB Browser Caching
HTTP Cookie Manager -> simulates Browser Cookie
 -> Click on HTTP cookie manager -> Uncheck Clear Coookies  each Iteration

With an enable HTTP Cookie Manager the request should look like
  GET http://localhost:8180/WFJPA2EL-1.0/
  Cookie Data:
  JSESSIONID=dIV4Kg4Ge1672IoaR75GPWcW.wls1
Without an HTTP Cookie Manager the Request looks like:
  GET http://localhost:8180/WFJPA2EL-1.0/
  [no cookies]
Recording a User Script With a Browser
For inital testing modify Thread Group : Number of Threads ( user ) : 1 Loop Count : 1 Use the Recording template File -> Templates -> Recording This creates a Test Plan with following major elements - User Defined Variables - HTTP Request Defaults - HTTP Cookie Manager - Thread Group - Recording Controller - View Results Tree - WorkBench - HTTP(S) Test Script Recorder - View Results Tree Verify HTTP(S) Test Script Recorder settings and start the Recorder --> Global Settings for Proxy Port : 8888 Go to the end of HTTP(S) Test Script Recorder Page and press << Start >> Prepare your WEBapplication by modify the Firefox Proxy Configuration Edit -> Preferences -> Advanced -> Network -> Settings -> Manuals Proxy Configuration HTTP Proxy : localhost Port : 8888 Remove Entries NO PROXY entries like : localhost, 127.0.0.1 Record the Session Start the initial HTTP GET request $ firefox http://localhost:8180/WFJPA2EL-1.0/ Now Press your GUI buttons to create the HTTP Post requests ! Review Recorded HTTP traffic under Thread Group -> Recording Controller -> 45 /WFJPA2EL-1.0 45 /WFJPA2EL-1.0 GET 46 /WFJPA2EL-1.0/ GET 47 /WFJPA2EL-1.0/faces/index.xhtml POST 48 /WFJPA2EL-1.0/faces/index.xhtml POST 49 /WFJPA2EL-1.0/faces/index.xhtml POST 50 /WFJPA2EL-1.0/faces/index.xhtml POST 51 /WFJPA2EL-1.0/faces/index.xhtml GET Now Replay the Recorded Session by pressing START and check the newly filled View Results Tree -> All POST request are failing with Error Count: 1 Response code: 500 Response message: Internal Server Error The HTTP GET request returns j_id1:javax.faces.ViewState:0" value="-3761271259220317840:-5309836328462799600"wheras the POST request sending back the old recorded ViewState variable javax.faces.ViewState=-4902608378562698912%3A-4211783223364451074
As you can see the ViewState variable returned from the HTTP GET request is different than the ViewState variable sent in the subsequent HTTP POST request. This is the root cause for getting Response code: 500 errors Fix : We need to extract the ViewState from the first GET request into a variable and arm our subsequent HTTP POST with that variable . Step 1: Extract the hidden Field ViewState into a Variable First Add a Debug Sampler Thread Group -> Add -> Sampler -> Debug Sampler Locate the ViewState value returned from the first HTTP GET request Thread Group -> View Result Tree [ Use the same HTTP requst ID as found in the Recording Controller output View Result Tree : 45 /WFJPA2EL-1.0/ Recording Controller : 45 /WFJPA2EL-1.0/ Copy from View Result Tree ( Use <ctrl>C and <ctrl>V for copy and paste ) the following Line : "j_id1:javax.faces.ViewState:0" value="-4364374341049834252:-7433662177008040460" autocomplete="off" Add regular Expression to extrace ViewState variable - Go the first HTTP GET request [ request 31 ] Recording Controller -> RC HTTP GET request -> Add -> Post Processors -> Regular Expression Extractor Reference Name : jsfViewState Regular Expression : input type="hidden" name="javax.faces.ViewState" id="j_id1:javax.faces.ViewState:0" value="(.+?)" autocomplete Template : $1$ Default Value : DEFAULT-VALUE-NOT-EXPECTED Note we changed in the Regular Expression Extractor : ViewState:0" value="-4364374341049834252:-7433662177008040460" to ViewState:0" value="(.+?)"
Now Replay and verify that Debug Sampler successfully extract the jsfViewState parameter View Result Tree -> Debug Sampler -> Response Data JMeterVariables: .. jsfViewState=8326703641583194307:-77748042595564357 jsfViewState_g=1 jsfViewState_g0=input type="hidden" name="javax.faces.ViewState" id="j_id1:javax.faces.ViewState:0" value="8326703641583194307:-77748042595564357" autocomplete jsfViewState_g1=8326703641583194307:-7774804259556435 -> jsfViewState variable is succesfully extracted from the HTTP GET request Step 2 : Replace all related POST request replace the ViewState Parameter with our extracted ${jsfViewState} Variable Goto Recording Controller click on the first POST Request wich is in our case : 32 /WFJPA2EL-1.0/faces/index.xhtml Scroll Down the Parameter Box and locate javax.faces.ViewState 7488737670588160729:2714299608714531806 true true Replace the value field 7488737670588160729:2714299608714531806 with our view state variable : ${jsfViewState} The complete record should now look like ;
-> Note be careful and remove any spaces behind ${jsfViewState} declaration Repeat this step for all subsequent HTTP POST requests . Rerun the recorded session - all HTTP operation should be flagged green
The last HTTP GET request reports in the Sampler Box : Thread Name: Thread Group 1-1 Sample Start: 2015-06-18 19:42:35 CEST Load time: 153 Connect Time: 0 Latency: 136 Size in bytes: 54033 Headers size in bytes: 0 Body size in bytes: 0 Sample Count: 1 Error Count: 0 Response code: 200 Response message: Number of samples in transaction : 5, number of failing samples : 0
Working with Assertions
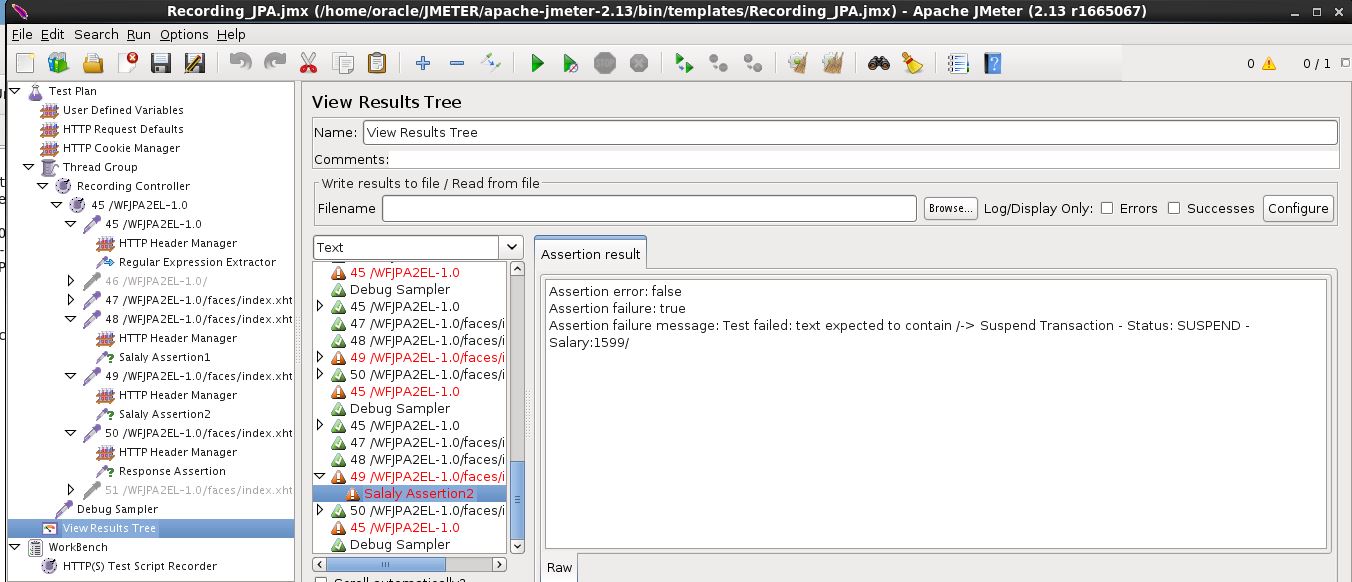
Duration Assertion First lets have a look as the current statistics for out HTTP Post request by looking on out Summary Report Samples Avg Min Max Std. DEv Error Throughput KB/s 16 /WFJPA2EL-1.0/faces/index.xhtml 3 17 12 28 7.318 0.0 18.98 96.11 -> We don't have any errors and the Average Response Time is 12 ms Rerun test again and check Summary Report Add a Duration Assertion for the above HTTP Post with : 12 ms Samples Avg Min Max Std. DEv Error 176 /WFJPA2EL-1.0/faces/index.xhtml 15 13 11 28 4.02 0.066 -> 6,6 % of our requests shown some ERRORS View Test Results Double click on the red marked Request Assertion error: false Assertion failure: true Assertion failure message: The operation lasted too long: It took 13 milliseconds, but should not have lasted longer than 12 milliseconds. -> Here we get Details about our failed Request Add a response Assertion to a HTTP POST Recording Controller -> RC HTTP POST -> Add Assertions -> Response AssertionIn this HTTP response we expect to find following test pattern : -> Suspend Transaction - Status: SUSPEND - Salary:1500 Reviewing a failed Response Assertion :
First Performance Tests
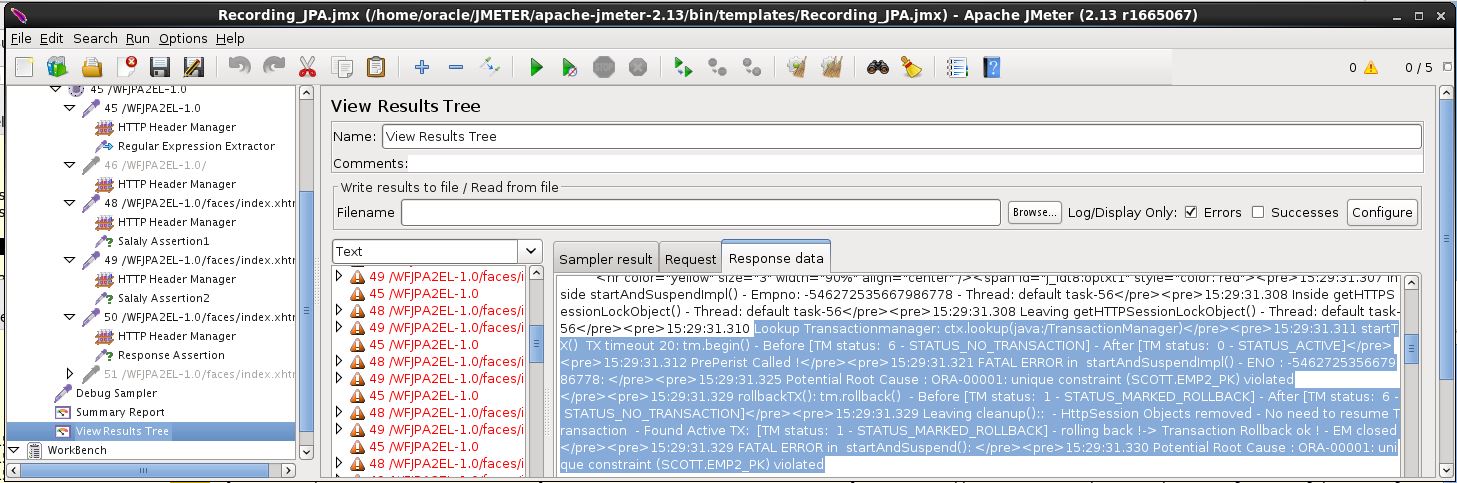
For last testing we are heavy business transaction doing the following : - HTTP Request1 : Request the inital page via HTTP GET request - HTTP POST Request2: Uses a HTTP post request to - Start a JTA transaction ( Not JTA transaction are always XA transactuons - Run JPA flush [ == Insert a new db record ] - Suspend the JTA transaction using the JEE TransactionManager API - Add JTA transaction object, Entity Manager object to our HTTPSession Object - HTTP POST Request3: Uses a HTTP post request to - retrieve JTA transaction object and Entity Manager object from our HTTPSession Object - Resume the Transaction and update the record - Commit the record - in case of any errors rollback the transacton - Cleanup HTTP session object , clear the Entity Manager - HTTP Request4: Uses a HTTP post request to - Invalidate the HTTP session For performance testing we modify our Thread Group : Number of Threads ( user ) : 5 Loop Count : 1000 This JMETER session will run 5.000 Business Transactions Note: Disable all Listeners for Throughput / Performance Testing as listeners are very CPU and Memory intensive . -> For the inital performance test we will run only using the Summary reportFindings : - We are running 5.000 Transactions with a throughtput of 200 HTTP request per second - About 0.18 % of our HTTP requests are failing - The average duration of our HTTP post are between 30 and 59 ms As we get some errors we will add the View Results Tree. Because we are in a testing phase where we print errors and runtine information to the User screen the HTML will give us an easy way to get details about the error
Some Deatails about Listeners
Useful Listeners
  - Summary Report
  - Repsonse Time Graph
  - View Results in Table
  - View Results Tree

Note Disable all Listeners for Throughput / Performance Testing as listeners
are very CPU and Memory  time intensive
Real Testing with RAC, JMeter and Virtaulbox
Test-Configuration 14:23:21.294 Calling getRacInfo() in progress ... 14:23:21.294 Hibernate Version: 4.3.7.Final 14:23:21.294 Driver Name : Oracle JDBC driver 14:23:21.294 Driver Version : 12.1.0.2.0 14:23:21.294 Database Product Version: Oracle Database 12c Enterprise Edition Release 12.1.0.2.0 - 64bit Production With the Partitioning, Real Application Clusters, Automatic Storage Management, OLAP, Advanced Analytics and Real Application Testing options 14:23:21.512 DB Name: BANKA 14:23:21.512 1. Instance Name: bankA_3 - Host: hract21.example.com - Pooled XA Connections: 32 14:23:21.513 2. Instance Name: bankA_1 - Host: hract22.example.com - Pooled XA Connections: 31 14:23:21.513 Leaving getRacInfo() without Exceptions ! All tests run on a single s Test Scenario - 10 Threads running a complex Transaction using suspend and resume 1000x - This translates to running 50.000 Transactions. Testcase Details - Using 2 datasources having MAX Connections set to 50 Datasource 1 is a JPA datasource and is used to operate on our JPA Entities Datasource 2 simulates a Normal datasource [ used as a tracking tool ] - Even we need to rollback our global transaction we need to write some log information before the ROLLBACK - The HTTP mentioned mentioned below are resp - HTTP POST request 1 : adds an Entity to the HTTP session object - HTTP POST request 2 : Starts the transaction running tm.begin() Calls em.flush() to store that record in our RAC DB asap Supspend the XA Transaction running tm.suspend() Logs some data via JDBC API and COMMITs that data [ this is possible as we have suspended our XA transaction ] Resume the transaction using tm.resume() Update our record running em.merge() Commit the data running tm.commit() Logs some data via JDBC API and COMMITs that data Configuration and Test details Host System: - Windows 8.1 - CPU i7-4710-HQ 2,5 GHz - 1 socket, 4 Physical CPus, 8 Logical CPUs - 16 Gbyte RAM Testcase - VirtualBox System I running : OEL 6.6, Wildfly 8.2 , 10 Threads ( running Jmeter ) - VirtualBox System II running : OEL 6.6, Oracle RAC 12.1.0.2.0 , Instance bankA1 - VirtualBox System III running : OEL 6.6, Oracle RAC 12.1.0.2.0 , Instance bankA2 - All VirtualBox System are configured to occupy a single physical CPU only What we exe expecting: - The testcase is CPU bound ( very little DB actions) - Our Host system running the Jmeter Threads should occupy about 100 % of our CPU. Single Core Testing - Verifiy CPU details on our JMeter VBox System Guest System [ OEL 6.6 ] details : [oracle@wls1 Desktop]$ nproc 1 [oracle@wls1 Desktop]$ lscpu Architecture: x86_64 CPU op-mode(s): 32-bit, 64-bit Byte Order: Little Endian CPU(s): 1 On-line CPU(s) list: 0 Thread(s) per core: 1 Core(s) per socket: 1 Socket(s): 1 NUMA node(s): 1 Vendor ID: GenuineIntel CPU family: 6 Model: 60 Stepping: 3 CPU MHz: 2496.669 BogoMIPS: 4993.33 L1d cache: 32K L1d cache: 32K L2d cache: 6144K NUMA node0 CPU(s): 0 -> Only a Single Physical CPU is active for our Virtualbox System running the Jmeter tests ! Jmeter test results :TaskManager Test results :
Resource Manager test results:
Test Summary: - No all CPU ticks available are used for our testing - This leads to a low TPS rate of 19.5 annd is far away from a real stress test Assumption : We assume that the VirtualBox System running the JMeter threads is limiting factor ! -> Let's add additonal CPU Power to the Virtualbos System Change VBox Configuration to use all 4 physical CPUs:
Verify transaction rate using JMeter Output:
Verify CPU Usage via Task Manager :
Test Summary after changing Virtualbox Setup to use all phy. CPUs - Transaction rate increased from 19,6 TPS to 51,5 TPS - All CPUs are running at 100 % speed
Excelente explicación, llevaba buen rato buscando la explicación y aquí fue.
Muchas gracias.