Table of Contents
Tuning Steps
- Run AWR to figure out any RAC specific performance problems
- Change your application / Change schema objects
- Verify performance gains with Jmeter
- Repeat step 1 to step 3
Review current Performance status by using AWR
Reviewing SQL performance and Cluster Wait Time
SQL ordered by CPU Time (Global)
    Captured SQL account for 54.4% of Total CPU Time (s): 235
    Captured PL/SQL account for 1.0% of Total CPU Time (s): 235
     Total     Per Execution     Percentage of Total
SQL Id         CPU (s)   Elapsed (s) IOWait (s)   Gets   Reads    Rows    Cluster(s)    Execs   DB CPU  DB time  IO Wait    Gets    Read  Cluster    Execs      SQL Text
5m84n5c8k0k4c    49.37    3,317.61    6.99     319,368    792    30,000    2,023.00    30,000     21.04   41.29     1.80    5.83    2.99    57.73      8.07     Insert into logemp2 values (se...
a1h541jgwjdsj    25.56      533.35    6.66   3,566,809    285    30,000      459.23    10,000     10.89    6.64     1.71   65.06    1.08    13.11      2.69     select logemp2x0_.LOGID as LOG...
1aa2fpqtx557g    11.53       43.59    0.06      94,906     37    30,034       17.74    30,034      4.92    0.54     0.02    1.73    0.14     0.51      8.08     update seq$ set increment$=:2,...
8fv480az2kx9h     7.15      568.46    0.12      34,968     11    17,377      556.21    17,377      3.05    7.08     0.03    0.64    0.04    15.87      4.68     select increment$, minvalue, m...
anxm5vn9kxahy     5.91      289.35    1.71      57,697    151    10,000      266.43    10,000      2.15    1.77     0.08    0.68    0.01     3.77      2.69     select emp2x0_.EMPNO as EMPNO1...
8nrq20tnp5wvx     3.03      75.80      0.83      40,162     22    10,000       68.54    10,000     1.29    0.94     0.21    0.73    0.08     1.96      2.69     update EMP2 set ENAME=:1 , JOB...

Top DB Objects
    Top DB Objects by DB Time with respect to Application, Cluster, User I/O, buffer busy waits and In-Memory DB events only.
    Tablespace name is not available for reports generated from the root PDB of a consolidated database.
Object ID    % Activity    Event                    % Event     Object Name (Type)          Tablespace
99421        11.28         gc current block busy     6.05       SCOTT.LOGEMP2_PK (INDEX)    USERS
                           gc buffer busy release    3.11
                           gc buffer busy acquire    2.04
99419          4.82        gc buffer busy acquire    2.04       SCOTT.EMP2_PK (INDEX)       USERS
                           gc cr block busy          1.80
99420          4.42        gc cr block busy          2.78       SCOTT.LOGEMP2 (TABLE)       USERS

-> Insert into log table logemp2 takes much DB CPU time and also consumers very high cluster Wait time
   We insert 3x more records into our log table ( 30.000 ) compared the record count for table EMP2 ( 10.000 )

-> Waits for Primay Key SCOTT.LOGEMP2_PK seems to be the major Wait Event and needs to be tuned first
Review and change/modify DB objects responsible for Logging
Current Object Creation scripts :
create table logemp2 ( LOGID number, EMPNO number(22),  message varchar(300) );
alter table logemp2 add CONSTRAINT  logemp2_pk  PRIMARY KEY (logid);
desc logemp2;

drop sequence SEQ_LOGEMP2;
create sequence SEQ_LOGEMP2  minvalue 1 maxvalue 9999999999999999999999999999
  start with 1 increment by 1 NOCACHE ORDER;

-> First tuning suggestions:
   Drop Primary Key for table Logemp2  andcreate sequence with CACHE Noorder

New Object creation script :
create table logemp2 ( LOGID number, EMPNO number(22),  message varchar(300) );
desc logemp2;
drop sequence SEQ_LOGEMP2;
create sequence SEQ_LOGEMP2  minvalue 1 maxvalue 9999999999999999999999999999
  start with 1 increment by 1 cache 1000 noorder;
Rerun JMETER tests and compare results
- Jmeter Thread Group Configurtion : 10 Threads / Loop Count: 1000
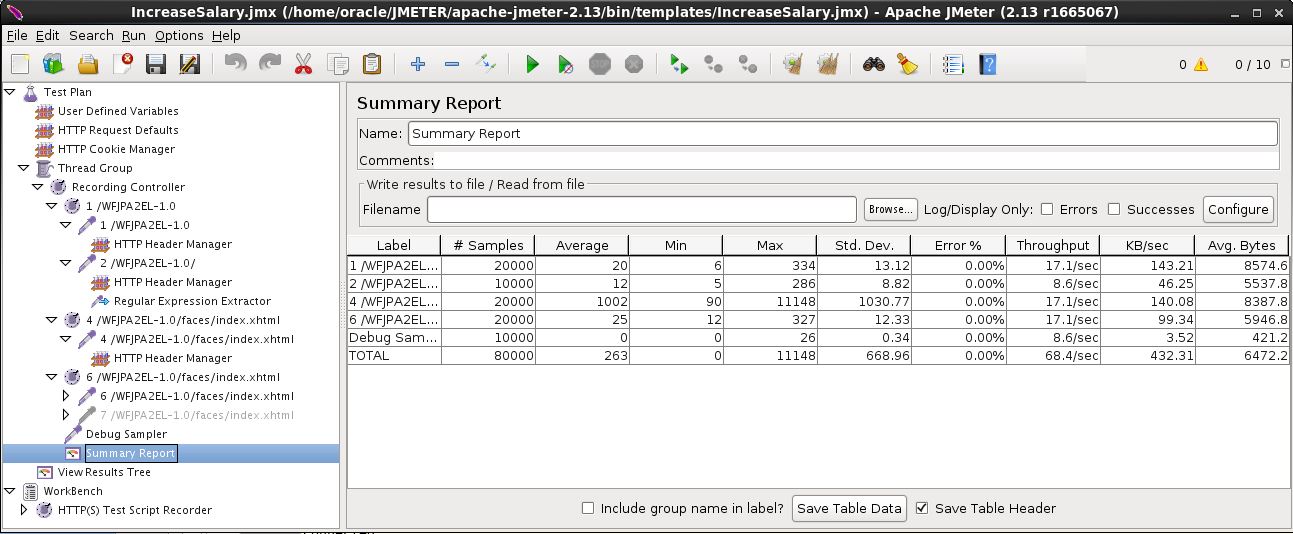
- Initial Jmeter test results
- Jmeter test results after applying above DDL changes
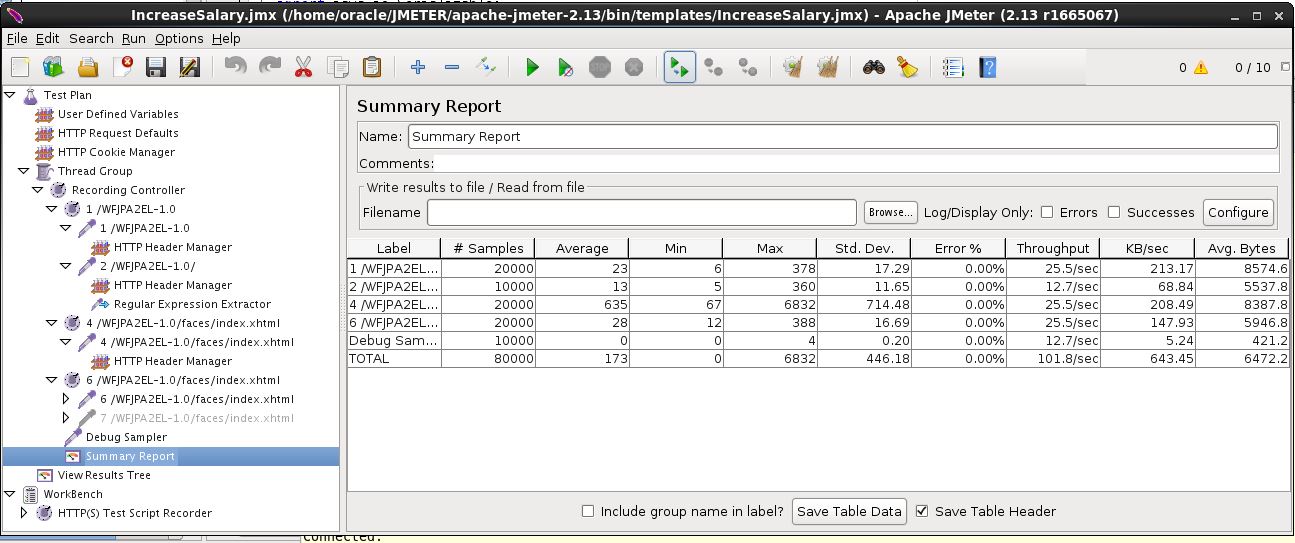
- This simple change increase the RAC performance by 50 % . Not bad for 10 minutes tuning
Further Tuning steps
- Lets have a look at the next tuning steps by reviewing AWR
Top Events
    Top Events by DB Time
    % Activity is the percentage of DB Time due to the event
Event                       Event Class   Session Type   % Activity  Avg Active Sessions
log file sync               Commit        FOREGROUND      35.32            3.20
log file parallel write     System I/O    BACKGROUND      15.39            1.39
gc buffer busy acquire      Cluster       FOREGROUND       9.06            0.82
gcs log flush sync          Other         BACKGROUND       8.67            0.78
gc cr block busy            Cluster       FOREGROUND      8.15             0.74

-> Using faster REDO LOGS and reduce the number COMMIT may be the next step of tuning