Table of Contents
Overview
Elapsed time Time: Interval of time between the start and end snapshots
DB Time          : DB Time is the time spent in the database by Foreground Sessions which includes
                      CPU time, IO time and No-Idle Wait time
                   Includes Cluster Waits, Commit Waits .....
                   Max DB Time in Cluster: MAX DB Time = Number_of_instances * AWR_Report_time * Number_of_CPUs
                   If it is more and multiples of elapsed time then one has to jump to the
                   TOP 5 Timed Events sessions  to investigate  further.
CPU Time         : CPU time represents time spent on CPU and does not include time waiting for CPU
Concurrency Top Wait Event Class
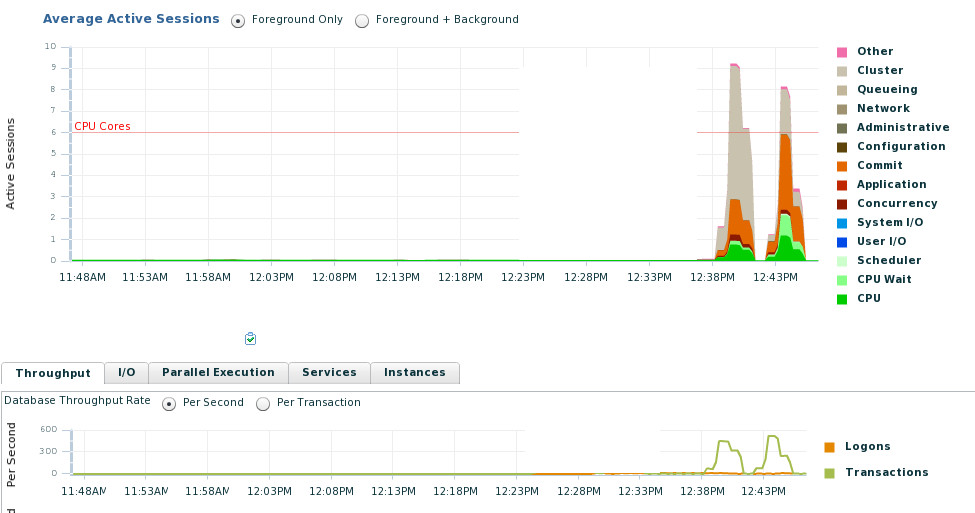
EM Report
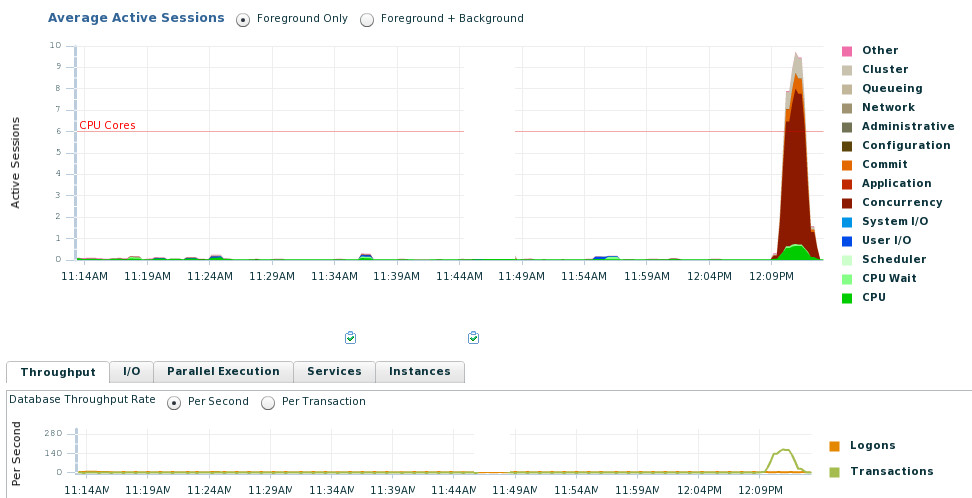
- Concurrency is the top Wait class
- Transaction rate is about 140 Tx/sec
AWR snapshot:
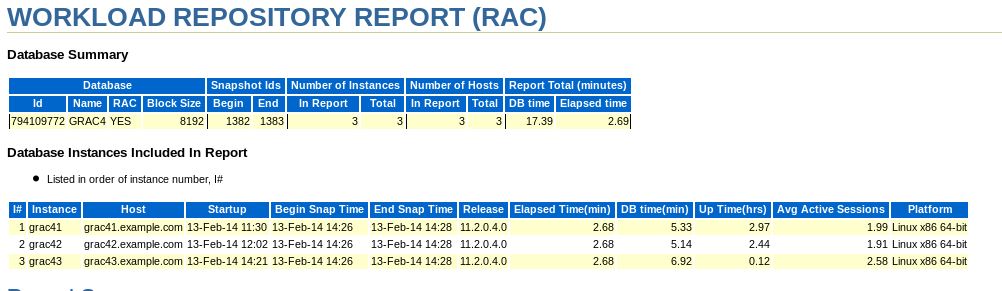
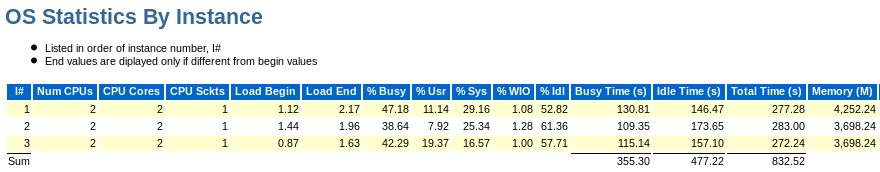
- There are 2 CPUs per instance / 6 cores are active for the complete cluster
- There is a huge DB Time compared to the Elapsed Time
- Question: Are we CPU bound ?
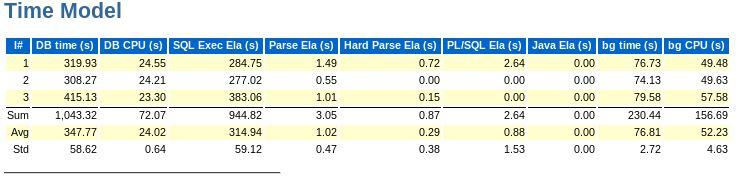
- Only about 12% from out DB Time is CPU time –> Lot of waits here
- For BG processes we don’t see to much Waits about 70% of bg time are on CPU ( bg CPU )
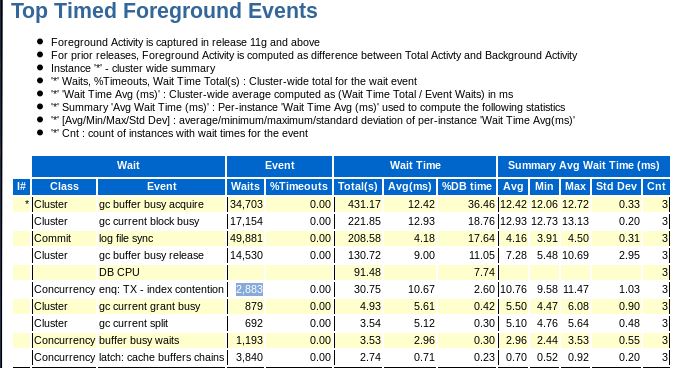
- The definitely means that we aren’t CPU bound so lets have a look on FG Wait TOP 5 Wait Events first
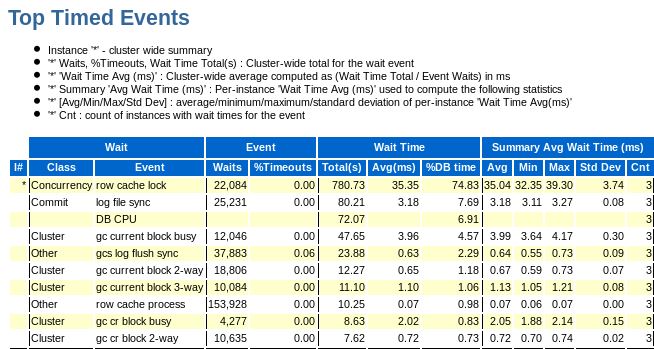
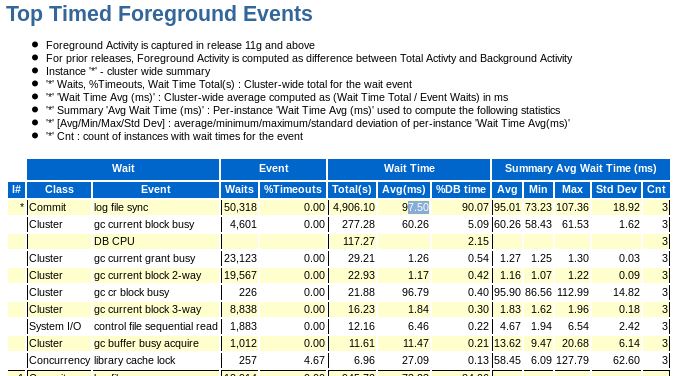
- Top Wait Event is Row cache lock with a Wait Time of 780 seconds
- Let’s see wether we can identify a SQL statement
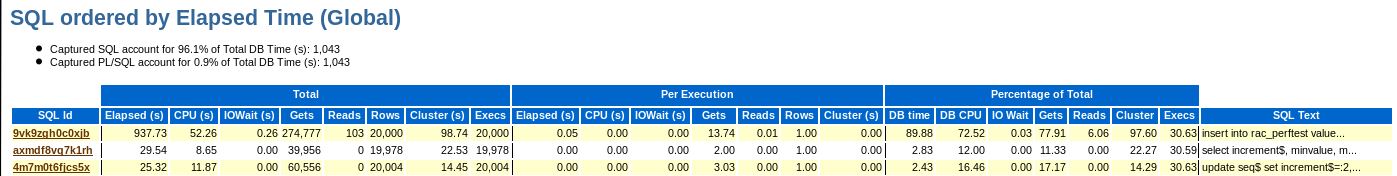
- Checking Insert statement taking 89 % DB time insert into rac_perftest values (t1_seq.nextval, :1 , :2 , sysdate)
- Insert statement triggers a Row Cache log by using seq.nextval()
- Following statement updating/selecting seq$ are the recursive statements triggered by the insert statement
- Statement 1: update seq$ set increment$=:2, minvalue=:3, maxvalue=:4, cycle#=:5, order$=:6, cache=:7,highwater=:8, audit$=:9, flags=:10 where obj#=:1
- Statement 2: select increment$, minvalue, maxvalue, cycle#, order$, cache, highwater, audit$, flags from seq$ where obj#=:1
- Both statments update seq$ and insert into rac_perftest were executed 20.000 times. Looks like a 1:1 relationship
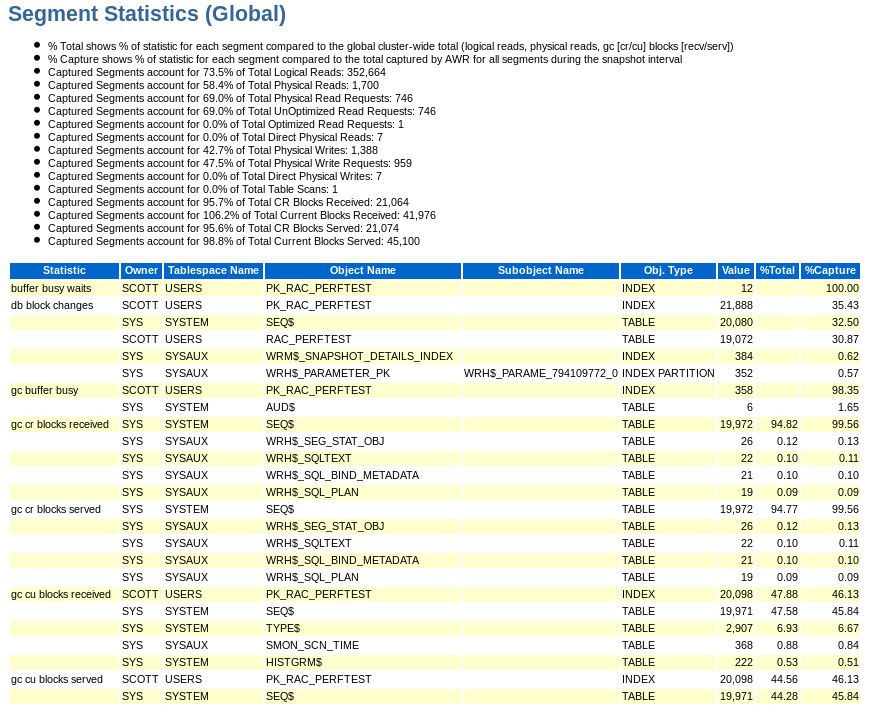
- Table SEQ$, table RAC_PERFTEST and Index PK_RAC_PERFTEST are changed more than 20,000 times ( db block changes Wait Event )
- Access to SEQ$ is responsible for about 20.000 Cluster Waits for gc cr blocks received/gc cu blocks received
Tuning Step 1 : Avoid sequences by using a JAVA generated sequence
Change SQL statement with sequence usage
   insert into rac_perftest values (t1_seq.nextval, ?, ?, sysdate) ";
to a SQL statment generating a JAVA based sequence using AtomicLong datatype
   private static AtomicLong counter = new AtomicLong();
   insert into rac_perftest values (?, ?, ?, sysdate) ";
- For more Details please read following article
Cluster Waits Top Wait Class
EM performance report
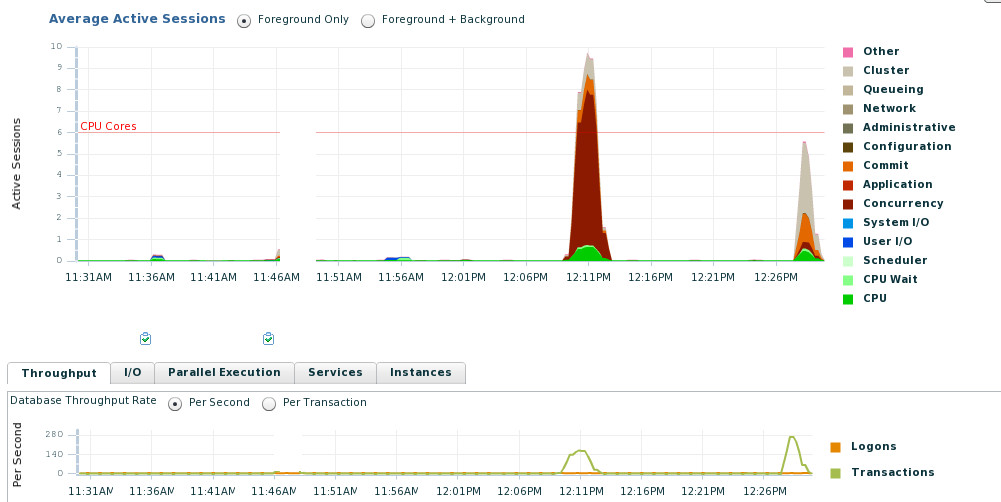
- After first tuning step ( 12:26) the Concurrency wait event was nearly completely eliminated
- Transaction rate nearly doubles
- Cluster Wait Event becomes the dominant Wait Event
AWR snapshot
- Cluster Wait Events : Gc buffer busy acquire and GC current block busy taking 54 % of our DB time
- TX index contention Wait event shows we have index block splits
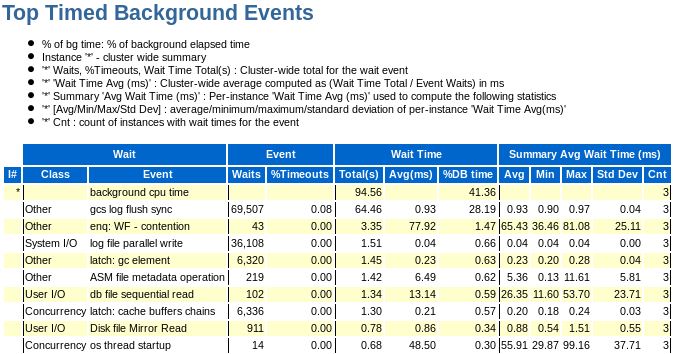
- GCS log fush sync is the top Wait Event for our BG process
- This is a sample where we have some contention from the Block Sending Side as dirty buffers needs to be flushed before transfering
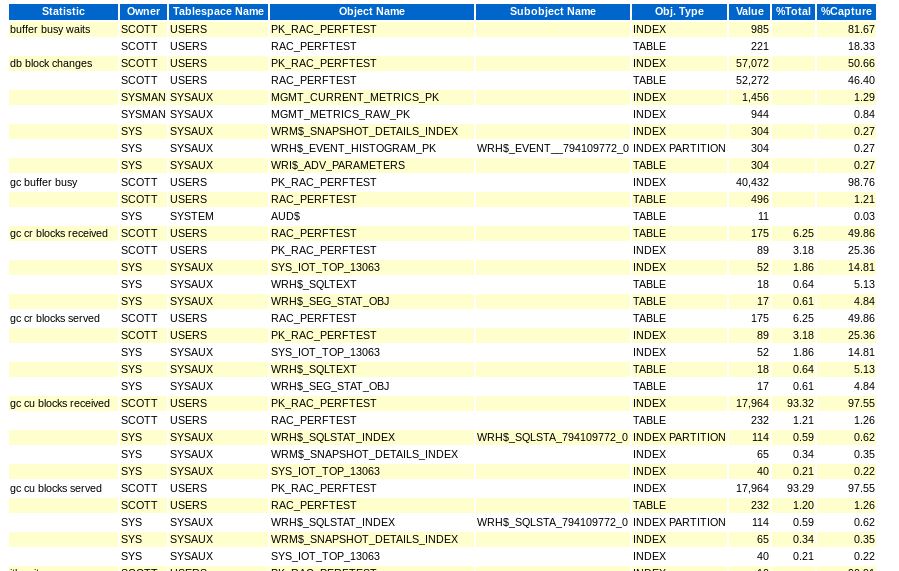
- GC Buffer Busy wait event listed 40.000 times together with GC current blocks received ( 18.000 times ) for Index PK_RAC_PERFTEST
- Huge Index Contention
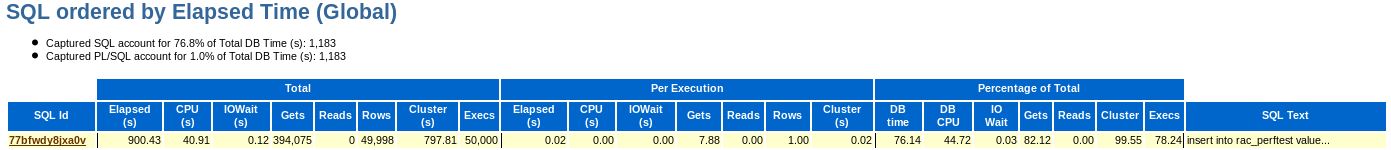
- Insert statement insert into rac_perftest is respnsible for 99 % for our Clusterwaits
- Use 10046 trace to get an idea whether the index keys used for insert triggers a RHS index contention
Verify RHS contention using gv$active_session_history view
SQL> select /*+ materialize */    event, current_obj#, current_file#, current_block#, Count(*) CNT,
  2           min(to_char(sample_time,'DD-MON HH:MI')) First_Wait,  max(to_char(sample_time,'DD-MON HH:MI')) Last_Wait
  3       from gv$active_session_history where event like lower('&event') and sample_time>&sample_time_start and  sample_time<&sample_time_end
  4        group by event, current_obj#, current_file#, current_block#
  5        having count(*) >= &grp_count
  6          order by CNT desc, current_block# ;
old   3:     from gv$active_session_history where event like lower('&event') and sample_time>&sample_time_start and  sample_time<&sample_time_end
new   3:     from gv$active_session_history where event like lower('gc%') and sample_time>trunc(sysdate) and  sample_time<sysdate
old   5:      having count(*) >= &grp_count
new   5:      having count(*) >= 5

EVENT                             CURRENT_OBJ#    file    block         CNT FIRST_WAIT   LAST_WAIT
-------------------------------- ------------ ------ -------- ---------- ------------ ------------
gcs log flush sync               -1           0        0          98 17-FEB 09:06 17-FEB 09:19
gc buffer busy acquire            95093       4   585283          14 17-FEB 09:17 17-FEB 09:19
gc buffer busy acquire            95087       4   585112          10 17-FEB 09:13 17-FEB 09:13
gc buffer busy acquire            95087       4   585027           9 17-FEB 09:12 17-FEB 09:13
gc current block busy             95093       4   585283           8 17-FEB 09:17 17-FEB 09:19
gc buffer busy acquire            95087       4   585100           7 17-FEB 09:12 17-FEB 09:12
gc buffer busy acquire            95087       4   585105           7 17-FEB 09:12 17-FEB 09:12
gc buffer busy acquire            95093       4   586558           7 17-FEB 09:19 17-FEB 09:19
gc buffer busy acquire            95093       4   576094           6 17-FEB 09:18 17-FEB 09:18
gc buffer busy acquire            95087       4   585085           6 17-FEB 09:13 17-FEB 09:13
gc buffer busy acquire            95087       4   585094           6 17-FEB 09:12 17-FEB 09:12
gc buffer busy acquire            95087       4   585218           6 17-FEB 09:13 17-FEB 09:13
gc buffer busy acquire            95093       4   585606           6 17-FEB 09:18 17-FEB 09:18
gc buffer busy acquire            95093       4   586555           6 17-FEB 09:19 17-FEB 09:19
gc buffer busy acquire            95093       4   586619           6 17-FEB 09:20 17-FEB 09:20
gc buffer busy acquire            95087       4   585127           5 17-FEB 09:13 17-FEB 09:13
gc buffer busy acquire            95087       4   585185           5 17-FEB 09:13 17-FEB 09:13
gc buffer busy acquire            95087       4   585196           5 17-FEB 09:13 17-FEB 09:13
gc buffer busy acquire            95093       4   585657           5 17-FEB 09:18 17-FEB 09:18
gc buffer busy acquire            95093       4   586186           5 17-FEB 09:19 17-FEB 09:19
gc buffer busy acquire            95093       4   586324           5 17-FEB 09:19 17-FEB 09:19
gc buffer busy acquire            95093       4   586332           5 17-FEB 09:19 17-FEB 09:19
gc buffer busy acquire            95093       4   586335           5 17-FEB 09:19 17-FEB 09:19
gc buffer busy release            95093       4   586557           5 17-FEB 09:18 17-FEB 09:18

24 rows selected.

SQL>
SQL> with  ash_gc as
  2  (select * from
  3    (
  4    select /*+ materialize */ inst_id,  current_obj#, current_file#, current_block#, Count(*) CNT,
  5           min(to_char(sample_time,'DD-MON HH:MI')) First_Wait,  max(to_char(sample_time,'DD-MON HH:MI')) Last_Wait
  6       from gv$active_session_history where event like lower('&event') and sample_time>&sample_time_start and  sample_time<&sample_time_end
  7        group by inst_id, current_obj#, current_file#, current_block#
  8        having count(*) >=  &grp_count  order by CNT desc, current_block#
  9      )
 10  )
 11  select * from (
 12  select inst_id,owner, object_name,object_type, current_file#, current_block#, cnt, current_obj#, First_Wait,Last_Wait
 13    from ash_gc a, dba_objects o
 14    where (a.current_obj#(+)=o.data_object_id) and a.current_obj#>=1
 15  union
 16  select inst_id, '','','Undo Header/Undo block' ,current_file#, current_block#, cnt, current_obj#, First_Wait,Last_Wait
 17    from ash_gc a
 18    where a.current_obj#=0
 19  union
 20  select inst_id, '','','Undo Block' , current_file#, current_block#, cnt, current_obj#,First_Wait,Last_Wait
 21    from ash_gc a
 22    where a.current_obj#=-1
 23  ) order by 7 desc
 24  /
old   6:     from gv$active_session_history where event like lower('&event') and sample_time>&sample_time_start and  sample_time<&sample_time_end
new   6:     from gv$active_session_history where event like lower('gc%') and sample_time>trunc(sysdate) and  sample_time<sysdate
old   8:      having count(*) >=  &grp_count  order by CNT desc, current_block#
new   8:      having count(*) >=  5  order by CNT desc, current_block#

   INST_ID OWNER      OBJECT_NAME          OBJECT_TYPE          file    block       CNT CURRENT_OBJ# FIRST_WAIT     LAST_WAIT
---------- ---------- -------------------- -------------------- ------ -------- ---------- ------------ ------------ ------------
     1                                     Undo Block               0        0        50         -1     17-FEB 03:07 17-FEB 09:19
     2                                     Undo Block               0        0        32         -1     17-FEB 03:07 17-FEB 09:19
     3                                     Undo Block               0        0        24         -1     17-FEB 03:07 17-FEB 09:19
     3     SCOTT      PK_RAC_PERFTEST      INDEX                    4   585283        13          95093 17-FEB 09:17 17-FEB 09:19
     2     SCOTT      PK_RAC_PERFTEST      INDEX                    4   585283         9          95093 17-FEB 09:17 17-FEB 09:19
     1     SCOTT      PK_RAC_PERFTEST      INDEX                    4   585283         9          95093 17-FEB 09:17 17-FEB 09:19
     2     SCOTT      PK_RAC_PERFTEST      INDEX                    4   585645         6          95093 17-FEB 09:18 17-FEB 09:18
     3     SCOTT      PK_RAC_PERFTEST      INDEX                    4   586619         6          95093 17-FEB 09:20 17-FEB 09:20
     3                                     Undo Block               2     2771         5         -1     17-FEB 03:03 17-FEB 03:03
Tuning Step 2 : Avoid RHS index growth by using Hash Indexes
Avoid Right-Hand-Side index growth by creating a Hash Index:
CREATE UNIQUE INDEX "HASH_IDX" on  rac_perftest (ID) GLOBAL PARTITION BY HASH (id) PARTITIONS 64;
- In 99% of OLTP performance issues write hot spots occur on indexes
- For more details please read following article
COMMIT top Wait Event Class
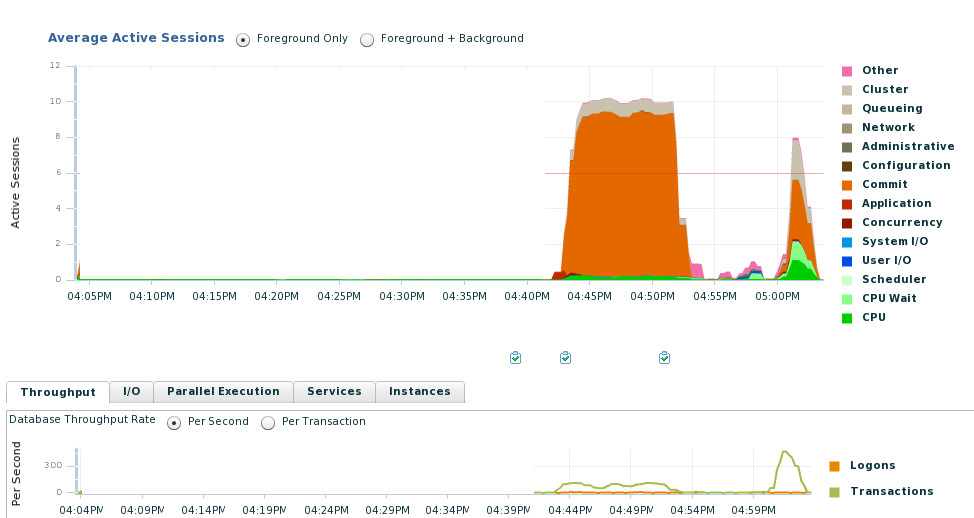
EM performance report
- Cluster Wait Events dropped a lot and TPS increased significant
- Commit Class becomes now dominant Wait Event
- CPU Wait also increases ( which is a good sign as we have 10 Insert Threads for 6 CPUs )
AWR snapshot
- Log File Sync is Top Wait Event taking 90 % of our DB Time
- Monitoring LOG Writer IO statistics is the next step
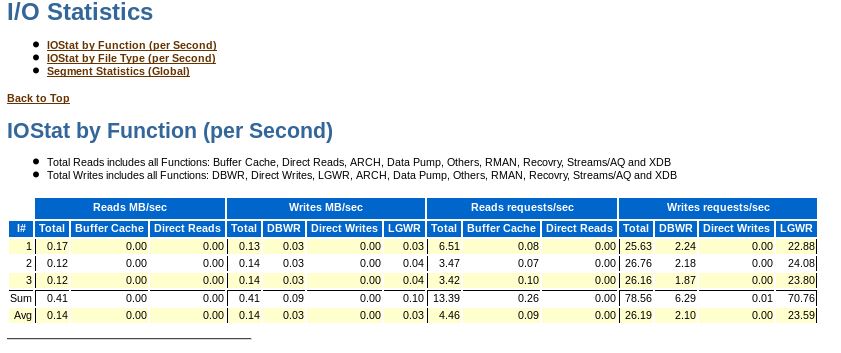
- LGWR only shows 70 Writes per second – Very slow !!
–> Suggestion : Test your Redo Write performance with dd
Tuning Step 3: Move Redo logs from overloaded Disks to SSD
- Transaction rate improves by factor 4
- Test Case runtime drops from 10 minutes to 3 minutes
- Even COMMIT is our Top Wait Event Class we also see CPU Waits – which is good
- Newly seen Cluster Waits are ok. They are related to table blocks still transferred between instances
- Following link explains LOG File Sync Wait Event more in detail.